BRANSON AREA LODGING STUDY
Lodging: Currently, in excess of 6,000 motel units front on Highway 76 in the immediate Branson area. Fronting the nearby connector and parallel roads are another 9,000 units. The survey completed in the Spring of 1993 estimated a total room count of 15,804 by the end of 1993. Figures released in the Spring of 1994 indicate that the room count increased to 19,577 by the end of 1994. As of March 10, 2011 there were 18,808 units within the city limits.
There have been few additional motel units built in the Branson area since 1996. The supply of motel rooms has exploded in the early 1990s with the “Branson Boom”. This building boom was a direct result of the excessive demand and high occupancy figures reported by motel operators in 1992 and 1993.
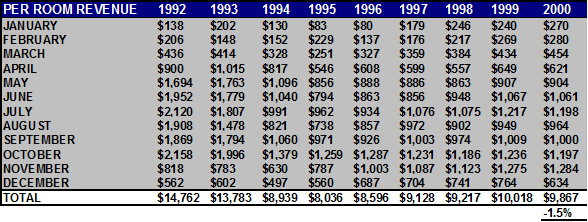
The 1991 season started strong with many motel managers reporting 50 percent or more occupancy by March. By the end of April to early May, occupancy was reported in the 75 to 80 percent range, many exceeding 85 percent. From June through November, occupancy was near capacity. The 1992 season started stronger than 1991, partly due to a mild winter, but mainly because of the publicity the area received from the “60 Minutes” piece which gave the area national exposure in the media. The tourists came earlier, stayed longer, and basically expanded the season. Most motel managers reported gross sales increases from 25 to 30 percent. The 1993 season was approximately ten percent below 1992 rates, from an occupancy standpoint. The number of tourists grew by five percent, but with the increased number of rooms, the average occupancy rates fell. The following statistics derived from local motel data indicates the changes in per room revenues between 1993 and 2010.
Final reports indicate that year end 2010 had Room Demand +0.8%, Room Rate +3.4%, Room Occupancy +2.3%, Room Revenue +4.2%, and Rev Par +5.8%.
Revenue History 1993-1995: The 1993 motel occupancy rates were down by approximately 10-15 percent below the 1992 rates due to the building boom. A nearly 42 percent growth in the number of rooms when the visitation only grew by five percent is a perfect example of excessive profits breeding possibly ruinous competition. However, 1993 occupancies were still ten percent above 1991 rates which was a strong market by local and national standards. Following this “boom” period of 1993 and 1994, per room revenues reached a low in 1995 as the “demand” (measured by the amount of tourists) could not keep pace with the dramatic increase in the number (“supply”) of rooms created by the new construction.
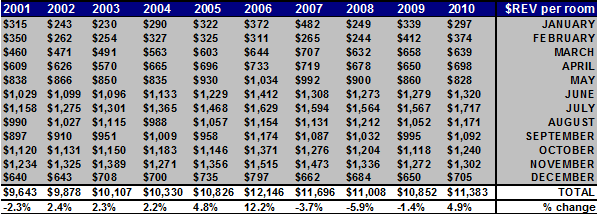
Revenue History 1996-2007: Beginning in 1996 the revenues began to recover with a 7% increase in revenues in 1996, followed by a 6.2% increase in 1997, a 1% increase in 1998, and an 8.7% increase for 1999. Year 2000 saw a 1.51% drop from 1999, which had been attributed to an excessively hot summer and December’s unusually icy conditions. ‘9-11” appears to have had an impact on Branson’s Fall Season with an overall drop of 2.27% for Year 2001[1]. With nationwide occupancies down nearly 6% due to the attacks, this 2.27% drop was considered to be fairly negligible, relatively speaking.
Year 2002 saw a 2.44% rise in room revenues with the 2003 numbers rising an additional 2.32%, 2004 revenues increasing another 2.2% and 2005 revenues up 4.8%. Year 2006 saw a rise in motel revenues of 7.6%. Much of this increase can be associated with the newly opened Branson Landing project which renewed interest to existing clientele as well as attracted a new graphic segment (slightly younger and more affluent). Year 2007 saw another 6.1% increase over 2006.
Year 2002 saw a 2.44% rise in room revenues with the 2003 numbers rising an additional 2.32%, 2004 revenues increasing another 2.2% and 2005 revenues up 4.8%. Year 2006 saw a sharp rise in motel revenues of 12.2%. Much of this increase can be associated with the newly opened Branson Landing project which renewed interest to existing clientele as well as attracted a new graphic segment (slightly younger and more affluent). Year 2007 saw another 4.9% increase over 2006.
With the nationwide economy beginning to decline in 2008 and further sliding in 2009, motel revenues were affected. Year end 2008 saw revenues up 3.9%. Occupancies were down but the rack rates (ADR) were up resulting in higher overall revenues.
In 2009, the total revenues appear to be down 3.2%. Occupancy was down 4.8% but the rack rates (ADR) stayed relatively stable.
Revenue History 2008 – Present: With the nationwide economy beginning to decline in 2008 and further sliding in 2009, motel revenues were affected. Year end 2008 was down 4.9%. Occupancies were down but the rack rates (ADR) were up.
In 2009, the total revenues were down 4.5%. Occupancy was down 4.6% and the rack rates (ADR) up slightly.
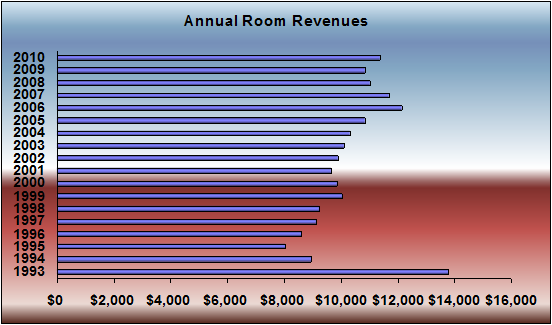
Finally 2010 showed a rebound in revenues by 4.2%, an increase in occupancy by 2.3% and an increase in ADR by 3.4%. Overall 2010 was a good year for the Branson motel market with revenues per room rebounding to almost the 2007 level.
Occupancy, ADR: The most recent market data in Branson indicates that the annual occupancies are down from almost 47% in 2007 to 41% in 2010. The average revenue per available room (REVPAR) is down from almost $33 to $32. The average ADR for the Branson market is up from $70 to almost $78. It should be noted that these numbers are market wide averages and are often skewed by “franchise” motels with higher revenues, rates, and occupancies.
Based upon conversations with local operators, the 2011 projection is that overall motels and hotels will perform as they did in 2010 and will be “stable”. The overall consensus is that the improving economy will be offset by rising gas prices that will stifle any increase in visitors.